

Executive Summary & Main Facts
The global gold market experienced a sharp sell-off on Tuesday, with spot gold (XAU/USD) retreating to its lowest level since March. The precious metal fell by 1.60% during daily trading, exchanging hands around the $4,260 mark at the time of writing. This marked a significant reversal from an intraday high near $4,350, highlighting the intense volatility currently gripping the commodities and foreign exchange markets.
This downward trajectory is driven by a powerful combination of macroeconomic and geopolitical factors. Primarily, a sudden rebound in the US Dollar (USD)—spurred by conflicting headlines regarding a potential peace agreement in the Middle East—has dented the appeal of dollar-denominated assets like gold. Concurrently, a persistently hawkish outlook from the US Federal Reserve continues to act as a major headwind for the non-yielding metal. With interest rates expected to remain elevated for an extended period, the opportunity cost of holding gold remains high, prompting investors to reallocate capital into liquid, interest-bearing US Dollar assets.
Adding to the market’s anxiety is the highly anticipated US Consumer Price Index (CPI) report scheduled for release on Wednesday. As inflation continues to drift further away from the Federal Reserve’s 2% target, market participants are bracing for data that could dictate the central bank’s monetary policy path for the remainder of the year.
Chronology of Geopolitical Developments: From Peace Hopes to Helicopter Downings
The price action on Tuesday was characterized by extreme intraday swings, directly tied to rapidly shifting narratives coming out of Washington and the Middle East. The timeline of these events illustrates how quickly geopolitical headlines can disrupt financial markets.
The Early Session: Optimism and De-escalation Hopes
Earlier in the day, market sentiment was decidedly risk-on. US President Donald Trump told reporters that negotiations with Iran to end the regional conflict were in their "final throes."
- "We’re in the final throes of what will be a very, very good deal," Trump asserted, suggesting that an agreement could be reached within a matter of days.
- Crucially, the President added that the Strait of Hormuz—a vital maritime chokepoint for global oil shipments—would reopen as soon as the diplomatic agreement was finalized.
This announcement initially triggered a wave of optimism across global trading desks. Investors anticipated that a resolution to the conflict would lead to a sustained decline in crude oil prices, thereby easing global inflationary pressures and potentially allowing the Federal Reserve to adopt a more accommodative monetary stance. During this window of optimism, the US Dollar Index (DXY) slipped to an intraday low of 99.68, allowing gold to touch its intraday peak near $4,350.
The Midday Reversal: The Apache Helicopter Incident
The optimistic narrative was abruptly shattered by a post from President Trump on his social media platform, Truth Social. Trump revealed that Iran had shot down a US Apache helicopter that was patrolling over the Strait of Hormuz.
While the President confirmed that both American pilots were safe and uninjured, he explicitly stated that the United States would have to respond to the hostile action.
   [Early Tuesday]                         [Midday Tuesday]
Negotiations in "final throes"  ───►  Iran shoots down US Apache
   - Optimism rises                      - Geopolitical risk spikes
   - DXY falls to 99.68                  - Safe-haven flows shift to USD
   - Gold hits high of $4,350            - Gold plunges to $4,260
This sudden shift from imminent diplomacy to potential military escalation caught market participants off guard. The conflicting headlines effectively extinguished hopes for an immediate peace deal, prompting a swift risk-off migration. However, instead of flocking to gold, investors favored the liquidity of the greenback. The US Dollar Index staged a rapid recovery, climbing back to the 100.00 psychological threshold and triggering a massive liquidation in the gold market, sending XAU/USD tumbling to $4,260.
Supporting Economic Data: Inflationary Pressures and the Federal Reserve’s Dilemma
While geopolitical headlines drove the day’s short-term volatility, the broader structural pressure on gold remains rooted in macroeconomic fundamentals—specifically, the trajectory of US inflation and its influence on Federal Reserve policy.
The Oil-Inflation Link
The outbreak of hostilities in the Middle East in late February triggered a sharp spike in crude oil prices. Because energy is a foundational input for the global economy, higher oil prices have quickly translated into broader consumer price inflation, derailing the progress the Federal Reserve had previously made toward its 2% inflation target.

The upward march of inflation is clearly visible in recent data:
- March: Annualized CPI rose to 3.3%.
- April: Annualized CPI accelerated further to 3.8%.
- May (Forecast): Economists expect the upcoming report to show a jump to 4.2%.
The Federal Reserve’s Policy Implications
This persistent upward march in inflation has forced the Federal Reserve to maintain a hawkish posture. The market is now keenly aware that Wednesday’s CPI report represents a major turning point:
| CPI Outcome vs. Expectations | Market Implications | Expected Gold (XAU/USD) Reaction |
|---|---|---|
| Stronger-than-Expected (Above 4.2%) | Cements expectations for a Fed rate hike later this year; reinforces "higher-for-longer" narrative. | Increased downward pressure; potential break of near-term support levels. |
| In-Line with Expectations (4.2%) | Confirms stubborn inflation; keeps the Fed on a hawkish hold. | Neutral to mild bearish bias; gold remains capped below key moving averages. |
| Shorter-than-Expected (Below 4.2%) | Offers breathing room; suggests inflation may be peaking, allowing Fed patience. | Short-term relief rally; potential test of immediate resistance levels. |
Official Rhetoric and Geopolitical Responses
The heightened volatility in global markets has been exacerbated by the unique communication style of the US administration and the highly sensitive nature of the Strait of Hormuz.
The Strait of Hormuz is widely regarded as the world’s most important oil transit chokepoint, with roughly a fifth of the world’s petroleum consumption passing through it daily. Any disruption—or threat of disruption—to this passage has immediate ramifications for global energy markets, supply chains, and inflation expectations.
┌────────────────────────────────────────────────────────┐
│               The Strait of Hormuz Dilemma              │
├────────────────────────────────────────────────────────┤
│ • Handles ~20% of global petroleum consumption daily.  │
│ • Blockade/Tension = Immediate surge in oil prices.    │
│ • Higher Oil = Higher global inflation.                │
│ • Higher Inflation = Hawkish Fed = Pressure on Gold.   │
└────────────────────────────────────────────────────────┘
President Trump’s dual messaging—promising an imminent, historic peace deal on one hand, while warning of military retaliation for the downed helicopter on the other—has left analysts and diplomats struggling to gauge the administration’s actual trajectory.
At the same time, the Federal Reserve has remained consistent in its messaging. Central bank officials have repeatedly emphasized that they will not hesitate to raise interest rates further or keep them restrictive for longer if inflation continues its upward trajectory. This unwavering stance has anchored Treasury yields and provided a solid floor for the US Dollar, ultimately starving the gold market of the capital inflows it typically enjoys during periods of geopolitical tension.
Technical Analysis: XAU/USD Chart Formations and Key Levels
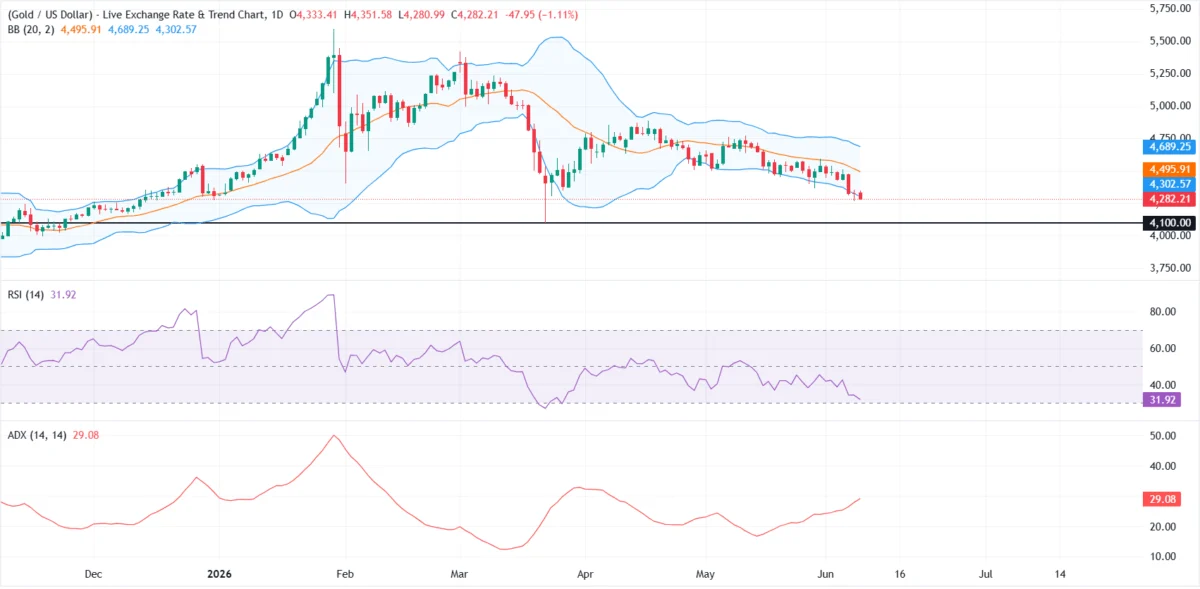
From a technical perspective, the daily chart for XAU/USD reveals a fragile configuration, with sellers firmly in control of the near-term price action.
Daily Bollinger Bands & Key Levels (XAU/USD):
============================================================
[Upper Bollinger Band]  ────────────────────── $4,687

[20-period SMA]         ────────────────────── $4,497 (Strong Resistance)

[Lower Bollinger Band]  ────────────────────── $4,306 (Immediate Resistance)

[Current Price]         ───────── $4,260 (Bearish Zone)

[Horizontal Support]    ────────────────────── $4,100 (Critical Floor)
============================================================
Key Technical Indicators
- Bollinger Bands: XAU/USD is currently trading below its 20-period Simple Moving Average (SMA), which sits at $4,496. More significantly, the spot price has slipped beneath the lower Bollinger Band, located around $4,306. This breach of the lower band underscores the strength of the current bearish momentum.
- Relative Strength Index (RSI): The RSI is currently hovering in the low 30s. While this indicates that the market is approaching oversold territory, it has not yet reached the extreme levels (below 30) that typically signal an immediate, exhaustive reversal. Instead, it suggests there is still room for persistent, near-term downside pressure.
- Average Directional Index (ADX): The ADX is currently printing near 29. In technical analysis, an ADX reading above 25 indicates a strong, well-defined trend rather than a range-bound, consolidating market. This points to a strengthening bearish trend rather than a temporary market correction.
Support and Resistance Levels
- Upside Resistance: On any attempted recovery, initial resistance is expected at the lower Bollinger Band boundary of $4,306. Above that, the 20-period SMA at $4,497 serves as a major barrier, followed by the upper Bollinger Band limit near $4,687.
- Downside Support: On the downside, if the bearish momentum continues, the next major cushion for bulls is the horizontal support line situated near $4,100. A decisive break below this level would open the door for a deeper corrective leg, potentially exposing gold to levels not seen since the first quarter of the year.
Market Implications and Future Outlook
The current dynamics in the gold market represent a significant shift in how the precious metal behaves during geopolitical crises. Traditionally, gold is sought after as a premier safe-haven asset during times of military conflict. However, in the current macroeconomic environment, this relationship has been disrupted by the overwhelming influence of the US Federal Reserve’s interest rate policy.
The Opportunity Cost Dynamic
Because gold is a non-yielding asset, it does not pay dividends or interest. When geopolitical tension leads to higher energy costs and subsequent inflation, and the central bank responds by raising interest rates, the "opportunity cost" of holding gold rises. Investors find it more profitable to hold cash deposits or short-term government bonds, which offer high, risk-free yields alongside the liquidity of the US Dollar. Consequently, the dollar has emerged as the preferred safe haven of this cycle, leaving gold vulnerable to liquidations.
Looking Ahead
The near-term outlook for XAU/USD hinges on two major catalysts:
- Diplomatic vs. Military Outcomes in the Middle East: If the US and Iran can move past the Apache helicopter incident and finalize the peace deal alluded to by President Trump, a subsequent drop in crude oil prices could quickly cool inflation expectations. This would relieve pressure on the Federal Reserve and pave the way for a recovery in gold prices. Conversely, military retaliation from the US would likely spike oil prices further, driving inflation expectations higher and cementing a hawkish Fed policy that would continue to depress gold.
- The May CPI Release: Wednesday’s inflation print is the most critical domestic data point of the week. A print that exceeds the 4.2% forecast will likely spark another round of selling in the gold market as traders price in a higher probability of near-term rate hikes. On the other hand, a surprise miss to the downside could provide the relief valve that gold bulls need to stage a technical bounce back above the $4,300 level.