

As the geopolitical crisis in the Middle East reaches its 101st day, the global financial markets find themselves in the grip of a profound anomaly. Since the onset of the U.S.-Iran conflict on February 28, 2026, the traditional inverse correlation between gold—the ultimate safe-haven asset—and oil—the lifeblood of the global economy—has begun to fracture. Despite the persistent choking of the Strait of Hormuz, a critical chokepoint for global energy supplies, market behavior suggests a decoupling that defies conventional economic logic.
This analysis explores the narrowing impact of oil prices on gold futures, the clandestine variables influencing supply-side data, and the shifting focus of investors as the Federal Reserve’s June meeting looms on the horizon.
The Chronology of Conflict and Market Volatility
To understand the current market behavior, one must revisit the catalysts that triggered the present volatility. On February 27, 2026—the eve of the U.S.-Israel military escalation against Iran—Brent crude futures traded at $72.53, WTI crude at $66.91, and gold futures at $5,224.
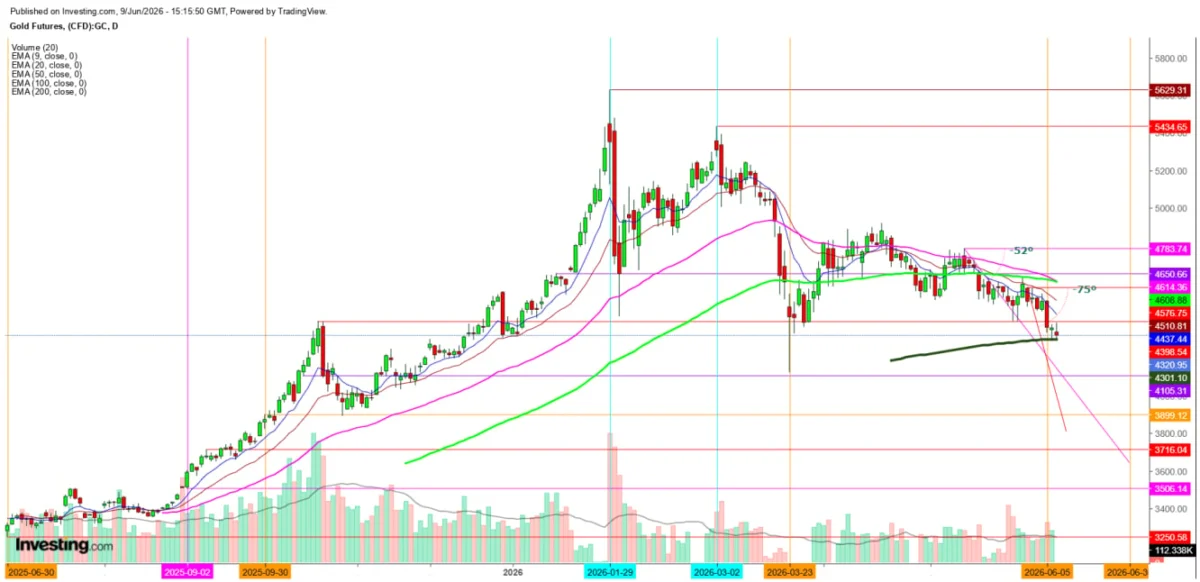
The immediate aftermath of the February 28 attack, combined with the subsequent blockade of the Strait of Hormuz, caused a seismic shift. The initial reaction was a predictable surge in energy prices, with gold acting as a hedge against the burgeoning geopolitical uncertainty. However, as the conflict persisted, the correlation began to shift. By March 2, 2026, gold reached a staggering record peak of $5,434.65. Shortly thereafter, the markets entered a period of volatile readjustment, with gold testing significant lows on March 23, 2026, aligning with the price levels observed in the crude oil markets at that time.

Today, on June 9, 2026, the market landscape presents a haunting parallel to that March 23 low. Gold futures, currently hovering near $4,309.80, are testing the technical support of the 200-day Exponential Moving Average (EMA) at $4,300. Should this level fail to hold, market participants fear a retest of the March lows, even as the Strait of Hormuz remains effectively closed to standard commercial traffic.
Supporting Data: The Widening and Narrowing Gaps
The relationship between Brent and WTI crude has been equally erratic. Following the outbreak of hostilities on February 28, the price gap between the two benchmarks widened significantly, reflecting localized supply chain disruptions.
The Slope of the Slide
The technical charts reveal a dramatic "70-degree slide" in energy prices from their May peaks. On May 15, 2026, Brent crude tested a peak of $109.78, while WTI hit $109.52 on May 18. Following these peaks, both assets experienced a sharp, aggressive descent. WTI, in particular, exhibited a steeper decline, with a 77-degree angle of descent compared to Brent’s 68-degree drop.
This divergence is critical. While both assets are trading significantly lower—with WTI at $88 and Brent at $91.41—the fact that these prices have retreated from their mid-May highs despite the ongoing blockade raises significant questions regarding the true nature of global oil flows.

The "Clandestine Flow" Hypothesis
One of the most pressing questions facing commodity analysts is why the oil market has remained relatively calm—or at least, significantly less volatile than one would expect—during one of the greatest supply shocks in modern history.
Despite the blockade of the Strait of Hormuz, the expected apocalyptic price surge has not materialized. This has led to the emergence of the "clandestine flow" hypothesis. There is growing evidence to suggest that tankers are increasingly dodging the blockade by turning off their Automatic Identification System (AIS) transponders. By operating in the "dark," these vessels may be ensuring a steady, albeit opaque, supply of crude reaches the global market, thereby artificially suppressing the volatility that would otherwise be driven by a genuine, total supply cutoff.
Furthermore, the market appears to have become desensitized to the geopolitical rhetoric emanating from Washington. While initial market swings were highly reactive to President Trump’s statements regarding a potential "Iran deal," the frequency of such threats on his social media handles has led to a "habituation effect." Investors are no longer treating every official statement as a harbinger of imminent change, shifting their focus instead to tangible, if clandestine, supply realities.
Implications for Investors and Central Bank Policy
The decline in both gold and oil futures is currently being interpreted by some as a reduction in global recessionary fears. However, this interpretation may be premature. The shift in gold’s trajectory is likely less about a waning desire for safety and more about a pivot in focus toward the Federal Reserve.

The Federal Reserve Factor
The upcoming Fed meeting on June 16-17, 2026, has become the gravitational center of the financial universe. Expectations for a rate hike are growing, and gold—a non-yielding asset—is feeling the pressure of a rising interest rate environment. The market is essentially weighing two competing narratives:
- The Geopolitical Narrative: The ongoing 101-day conflict and the supply crisis in the Strait of Hormuz, which traditionally favors gold.
- The Macro-Monetary Narrative: The Federal Reserve’s determination to combat inflation via rate hikes, which historically acts as a headwind for gold prices.
As of early June, the macro-monetary narrative appears to be winning. The breakdown of the inverse correlation between gold and oil suggests that investors are pricing in a future where liquidity conditions tighten, regardless of the situation in the Persian Gulf.
Conclusion: A Market in Search of Direction
The current state of the global markets is a paradox. We are witnessing a persistent supply chain blockade alongside a softening of energy prices, and a safe-haven asset (gold) that is failing to sustain its highs during a period of active international conflict.
The technical support at the 200 EMA for gold is currently the most critical level to watch. A decisive break below $4,300 would suggest that the market has fully discounted the geopolitical risk, choosing instead to align with the tightening monetary policy expected from the Federal Reserve.

For the energy sector, the narrowing gap between Brent and WTI will remain a key indicator of whether the supply-side situation is normalizing—whether through a diplomatic breakthrough or, more likely, an increase in "dark" shipping activity.
Disclaimer: This analysis is provided for informational purposes only and is based on observations of current market trends. It does not constitute financial advice. Readers are strongly advised to conduct their own due diligence and consult with professional financial advisors before taking any position in gold, oil, or related financial derivatives, as all market investments carry inherent risks.